Evaluate a Stock like A Pro


If you feel lost while staring at the numbers on most stock trading apps, you are not alone. Most financial websites display dozens of metrics about a company, but the data only become useful when you understand what they measure and how to interpret them.
In this article, we will use the Stock Analysis as an example to explain how to interpret the metrics to make proper investmentAn asset or commitment of money made with the expectation of future income, growth, or both. decisions.
At the end of this article, you will be able to:
- Evaluate a company's demand and sustainability using its revenue and net incomeProfit remaining after operating costs, financing costs, taxes, and other recognised items.
- Interpret key metrics such as volume, dividendA payment made from a company's profits to eligible shareholders. and P/E ratio
- Perform a quick analysis on a company using Stock Analysis
#Market Capitalization (Market Cap)

Market cap is the total value of a company's outstanding shares at the current share priceThe market price at which one share is quoted or traded.. Since share price changes when the market is open, market cap is not a fixed number.
It is calculated as:
Market Cap = Current Share Price * Total Outstanding Shares
Total Outstanding Shares is the total number of shares held by all shareholders excluding the shares that were repurchased by the company.
If a company has 10 million outstanding shares and its current share price is 1,000 naira, its market cap is:
1,000 * 10 million = 10 billion
Market cap is used to measure a company's size. A stock trading at 1,000 naira can be a larger company than the one trading at 2,500 naira if the first stock has a larger market cap.
For instance, Company A has a share price of 2,500 naira and 10 million outstanding shares. Company B has a share price of 1,000 naira and 100 million outstanding shares.
Market Cap of Company A = 2,500 * 10 million = 25 billion
Market Cap of Company B = 1,000 * 100 million = 100 billion
Company B is four times larger than Company A despite having a lower share price.
#Revenue (TTM)

Revenue is the total money generated from the sale of a company's core products or services during a specific period before deducting any expenses. 'TTM' means that it is the total revenue a company generated over the past 12 months.
Revenue (TTM) is calculated as:
Revenue (TTM) = Q_1 + Q_2 + Q_3 + Q_4
If the last 4 quarters are:
- Q3 2025 with a revenue of 40 billion
- Q2 2025 with a revenue of 30 billion
- Q1 2025 with a revenue of 32 billion
- Q4 2024 with a revenue of 30 billion
The revenue (TTM) will be:
40 billion + 30 billion + 32 billion + 30 billion = 132 billion
Revenue gives you insight on the demand on the company's core products. Consistent revenue growth suggests that demand for the company's product or service is strong and stable
#Net Income (net profit)
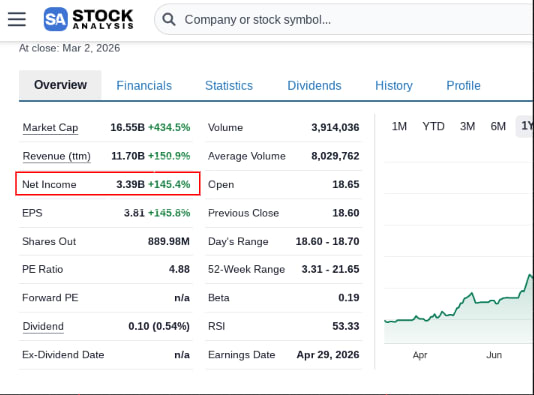
Net income, also called net profit or profit after tax, is the actual profit generated by the business after removing every expense incurred from the revenue.
It is calculated as:
Net Income = Total Revenue - Total Expenses
But financial statements rarely have total expenses calculated. Instead, we can calculate net income using:
Net Income = Pre-Tax Profit - Income Taxes
These metrics can be found on the income statementA statement showing revenue, expenses, and profit over a period.. Let us calculate the net income of The Initiative Plc (TIP):
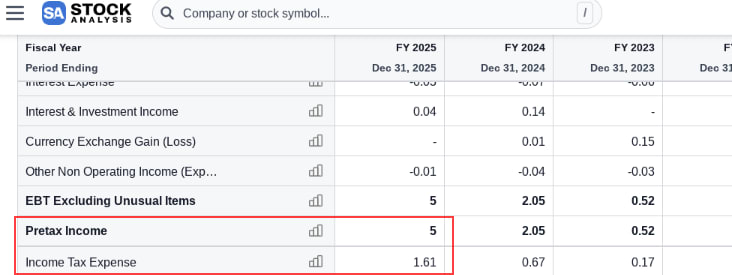
From the income statement above, we see that the net income is:
5 billion - 1.61 billion = 3.39 billion
Net income shows you the sustainability of the business. If a company reports consistent high revenue but declining net income, it means that its expenses are growing faster than the earnings. If this continues, it will be unable to fund its growth or pay shareholders without taking on more debts.
#Earnings-per-share (EPS)

EPS tells us how much of the company's profit is allocated to each individual share.
It is calculated as:
EPS = (Net Income - Preferred Dividends) / Weighted Average Outstanding Shares
Preferred dividends are fixed payments made to preferred shareholders and must be paid before any other dividend.
Preferred dividends is calculated as:
Preferred Dividends = Dividend per Share * Weighted Average Outstanding Shares
- Dividend per share is the total amount of dividend a company pays on every individual share of outstanding common stockA share that usually carries voting rights and a residual claim on a company's profits and assets..
- Common shares are a type of shares that gives its holders the right to vote in the company's decision but are the last to be paid in cases of bankruptcyA legal process for an entity unable to meet its financial obligations. or liquidationThe process of selling an entity's assets, paying creditors, and distributing any remainder to owners.. Dividend payment on common shares is also not guaranteed.
- Outstanding common share is the total number of a company's common shares held by all its shareholders.
If a company has 889.98 million weighted average shares outstandingThe total shares currently held by all shareholders, excluding shares retired by the company., a dividend per share of 0.10 naira, and a net income of 3.39 billion, to get its EPS, first calculate the total preferred dividends:
Total Preferred Dividends: 0.10 * 889.98 million = 88.998 million
Then calculate EPS:
EPS = (3.39 billion - 88.998 million) / 889.98 million = 3.71
Every share in the company is allocated a profit of 3.71 naira.
EPS helps you compare the profitability of companies of different sizes. For instance, a company with a market cap of 500 billion but with an EPS of 2.5 may be less profitable than another company in the same industryA more specific group of companies with closely related products or services. with a market cap of 250 billion but with an EPS of 3.71.
Comparing the EPS growth of a company over 3-5 years can tell you if it is improving its earning power.
We use Stock Analysis to know if a stock will perform well or not — it gives us the updated data needed to make informed investment decisions.
#Price-to-Earnings (P/E ratio)

Price-to-Earnings ratioShare price divided by earnings per share. (P/E ratio) shows the relationship between a company's share price and its earnings. It is how much investors are willing to pay for every 1 naira of the company's profit.
It is calculated as:
P/E ratio = Current share price / EPS
If a company's share price is 18.6 naira and its EPS is 3.81 naira, its P/E ratio is:
P/E Ratio = 18.6 / 3.81 = 4.88
This means that investors are paying 4.88 naira for every 1 naira of the company's profit. This is generally regarded as low, as the average P/E ratio of most markets is between 15-25.
Apart from the general average, it is also important to compare each company's P/E ratio to its industry average. A P/E ratio of 4.88 in the Tech or Banking industry is considered low but in a capital intensive industry like Steel, P/E ratio below 5 is normal.
P/E ratio shows investors' expectations on a stock. A P/E ratio above the industry average means investors are paying more for the company's earnings. This is either because they expect strong future growth or because the stock is overpriced.
A P/E ratio below the industry average means investors are paying less for its earnings, either because they expect earnings to decline or the stock is undervalued.
P/E ratio alone cannot tell you if the stock is overpriced or undervalued. To confirm this, check the company's 3-5 year trend on revenue growth, net profit marginNet income expressed as a percentage of revenue. and debt levels.
#Volume and Average Volume

Volume (daily trading volume) is the total number of shares traded in a day. If the volume of a stock is 1 million, it means that 1 million shares were exchanged between traders that day.
The average volume (average trading volume) indicates the average number of shares traded per day. It is calculated as:
Average Volume = Total trading volume over (N) days / Number of trading days (N)
(N) can be any number of trading days. If you are to use 30 trading days as (N), then you would sum the daily trading volume for 30 days and divide it by 30.
The volume and average volume of a stock help you determine the number of participants in a market and how easy it is to enter or exit trades. For instance, if you want to trade 2,000 shares on a stock that has an average volume of 10,000, you may not get enough traders to fill your order since it is 20% of the entire volume.
It is also important to compare average volume with the recent daily volumes. If daily volumes rarely reach the average volume, the average may have been inflated by a single large spike. Hence, it does not represent the actual number of trades in the market.
#Dividend
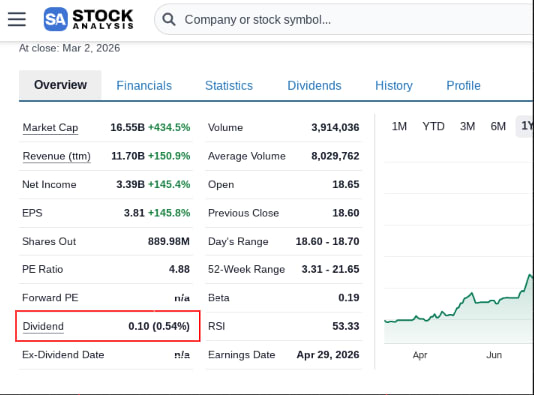
Dividend is the portion of a company's earnings that is distributed per share as return on investment. This means that if a company's dividend is 0.1 Naira, and an investor owns 1,000 shares, their gross dividend is:
Gross Dividend = 0.1 * 1,000 = 100 naira
But this is not the actual amount that is paid to the investor. Companies deduct withholding tax. Meaning that if the withholding tax is 10%, the actual dividend paid is calculated as follows:
Withholding Tax = Tax Rate * Gross Dividend
Withholding Tax = 10% * 100 naira = 10 naira
Actual Dividend = Gross Dividend - Withholding Tax
Actual Dividend = 100 - 10 = 90 naira
#Final Thoughts
No single metric on Stock Analysis tells you if a stock is worth buying. The data only becomes useful when you combine it with the others.
The market cap tells you the company's size while the volume shows how easy it is to trade. Revenue and net income tell you if it makes money, EPS shows how much profit belongs to each share, and the dividend shows how much of the profit is distributed to investors.
The next step is to practice. Pick any stock, open it on Stock Analysis and evaluate it using only the metrics in this article. If the numbers suggest profitability and positive market expectations, you have a stock worth researching further.
Test your knowledge
How is Market Capitalization calculated?
Emmanuella is an expert financial Analyst, an investor and a fine writer.
Become a member
Graded practice exercises with instant answer evaluation, daily streaks, certificates, and access to the private members community.
Become a memberCourses you might like
See all →
Startup Investor Fundamentals
Learn how startup and private company investing works, how to evaluate deals, understand ownership and dilution, verify claims, and avoid common beginner mistakes.

Compound Interest
Learn how money grows when returns stay invested, and how time, regular contributions, and inflation affect your results.

The Nigeria Capital Market
Most Nigerians who want to invest do not know who controls the market, what the rules are, or which platforms are safe to use. This course walks you through the entire Nigerian investment system, who the players are, what they do, what you can invest in, and how to check that anyone you give your money to is legitimate.